Introduction
In prior posts, I’ve focused mostly on the outcome of FAA obstruction evaluation studies: for example, what factors drive FAA determinations and how to improve your odds of receiving a favorable determination for your wind projects. But, the outcome of an obstruction evaluation study is only half of the story.
The uncertainty in FAA study timelines can pose an equally significant planning challenge to wind developers. For example, if an OE study drags on for several months, it can start to affect project financing, permitting, and construction timelines.
This post aims to shed more light on this topic by summarizing an analysis I performed on the timelines of historical FAA studies1. From the outset, I was particularly interested in answering the question:
Are proposed wind turbines that exceed FAA obstruction standards2 more likely to have longer reviews by the FAA?
As it turns out, yes, indeed they do – and pretty substantially.
But in the process of answering that question, I also uncovered a number of other interesting trends in FAA study timelines over the past two decades. Each trend is summarized under a separate heading below, with charts and supporting details. I hope you’ll the results as insightful as I did.
Trend 1
The time to complete FAA obstruction evaluations for turbines increased substantially over the last decade.
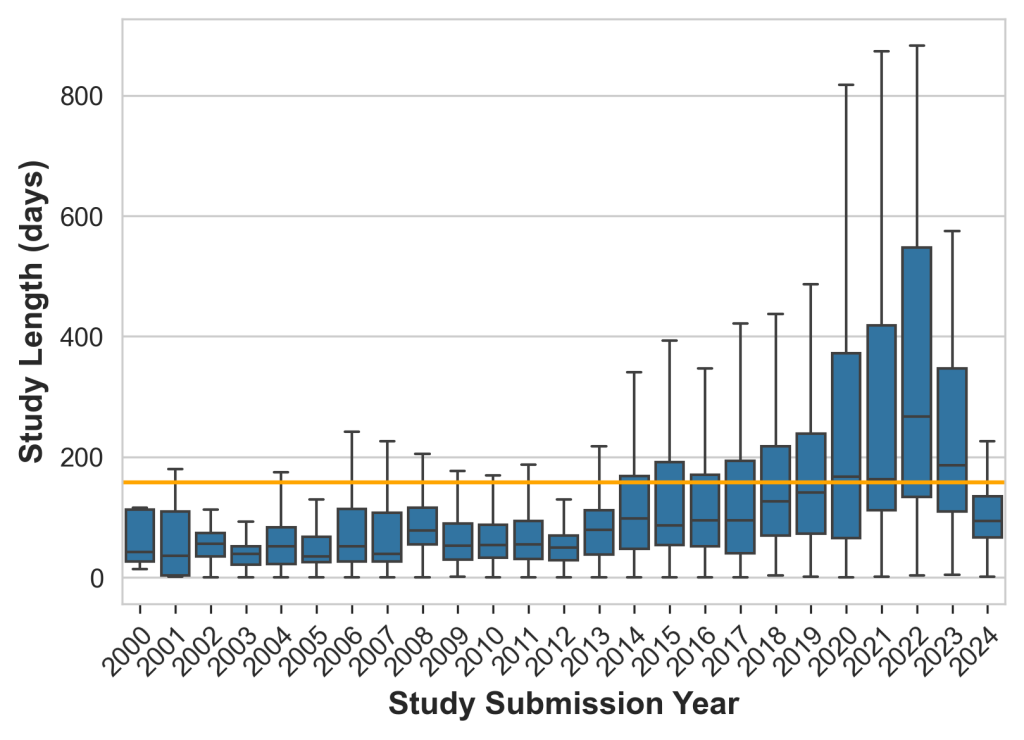
The first trend I looked at was simply how the duration of FAA reviews for proposed turbines has changed over time. In the figure below, you can see a box and whisker plot of the number of days studies took to be completed, grouped by year since 2000. I also included the overall mean duration across all studies, shown as an orange line across the plot.

From 2012 to 2022, there was a steady and substantial rise in the time that studies took to be completed, increasing over 5x from a median of ~50 days to ~270 days. Those numbers peaked in 2022 and have come back to earth in 2023 and 2024, although the data for 2024 is not yet complete.
This pattern raised the question: what factors drove the observed increase in FAA obstruction evaluation study times?
Trend 2
The count of proposed turbines submitted for FAA review is slightly up in recent years, but is consistent with the previous 15 years.
A reasonable hypothesis to explain the observed increase in FAA review times from 2014 through 2022 is that the FAA simply received larger amounts of turbine applications in those years. Maybe the FAA staff just got inundated with applications and, as a result, review speeds slowed down.
To explore this theory, I plotted the count of wind turbines submitted for FAA review by year, as shown in the next chart. As in the previous chart, the orange line shows the mean value over all years. The cyan line shows the mean count per year since 2010.

There’s a lot going on in this figure, but the key takeaway is that the increase in study times noted in Trend 1 does not seem to be attributable to more turbine submissions. Between 2000 and 2010, there was a clear and substantial upward trend in the number of turbines submitted for FAA reviews; however, since then, there have been smaller upward and downward trends on a roughly 5-year cycle. We’re currently on an upward trend, close to the average over the past ~15 years.
So, if review times didn’t get longer because the FAA had more studies to handle, what factor is to blame?
Trend 3
The percentage of proposed turbines exceeding FAA obstruction standards has followed a similar trend to review timelines.
Another logical hypothesis to explain longer reviews is that more turbines were found to be in conflict with FAA obstruction standards, necessitating more time to investigate and resolve or mitigate potential adverse effects.
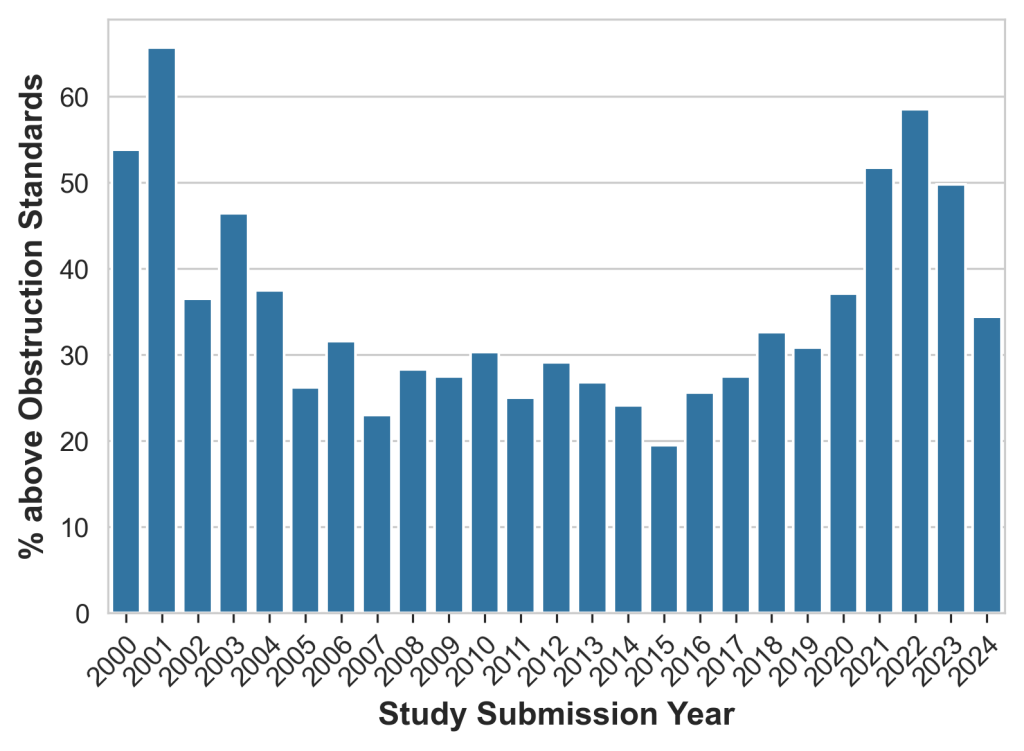
To investigate this hypothesis, I spatially overlaid all proposed turbines in the historical studies database with the above-ground height limits for the civil aviation features mapped by RootGeo to determine whether each turbine exceeded any FAA obstruction standards. Then, I calculated the percentage of all turbines exceeding one or more of these standards for each year. The figure below shows how this percentage has varied over time.

As you can see, the percentage of proposed turbines exceeding obstruction standards increased steadily from around 2015 through 2022, then has started to come down in 2023 and 2024. This is very similar to the trend in study timelines.
In fact, if we remove the earliest years from the dataset (2005 and earlier), which have a very small sample size, the relationship between study timelines and the percent of turbines—as shown shown in the figure below—is pretty compelling. The positive linear trend in this figure strongly suggests that observed trends in FAA study lengths may be driven by the percentage of turbines that exceed FAA obstruction standards.

Trend 4
Proposed turbines are likely to have longer FAA reviews if they exceed obstruction standards.
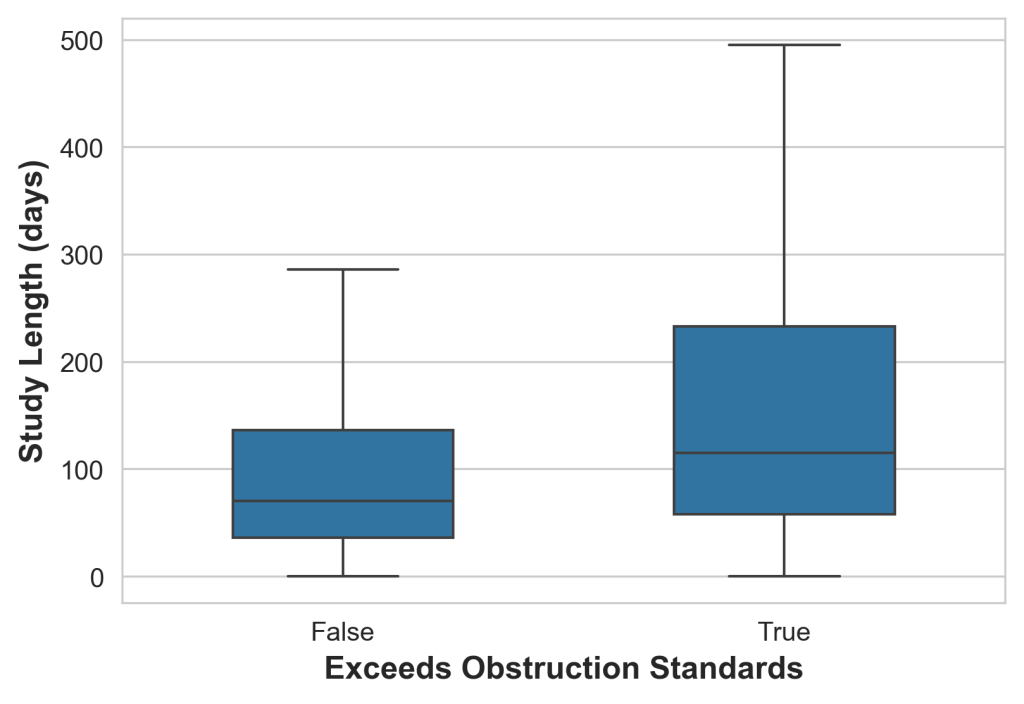
Based on the previous result, I took a closer look at how FAA obstruction evaluation study times differed depending on whether the turbine exceeded obstruction standards. The box and whisker chart below shows how review times varied between turbines that exceeded obstruction standards (“True”) and those that did not (“False”).

From the figure, it’s apparent that that turbines that exceed obstruction standards have generally had longer review times than those that do not. In fact, the median review time is about a month and a half longer for turbines exceeding obstruction standards (115 days vs. 70 days). This difference is statistically significant.3 Furthermore, it turns out that FAA reviews taking 1 year or longer have been approximately 2 times more frequent for turbines exceeding obstruction standards.4
Takeways
In my opinion, there are three big takeaways from this analysis:
First, proposed turbines that exceed obstruction standards are more likely to have longer reviews by the FAA. Historically, the median timeline has been just under 4 months for turbines exceeding obstruction standards compared to just under 2.5 months for those that do not.
Second, turbines exceeding obstruction standards are also at greater risk of very extended reviews that could jeopardize other project development timelines. Reviews of one year or longer have been 2x more common when turbines exceed one or more obstruction standards.
The final takeaway is a little more nuanced, so bear with me for a second. In previous posts, I’ve placed more emphasis on a subset of aviation features that are likely to be associated with aviation traffic (e.g., approach routes, airways, etc.) because these are the features most clearly linked to Determinations of Hazard, both theoretically and empirically. But in this analysis, I included the broader set of aviation features associated with obstruction standards, under the assumption that exceeding any obstruction standard would be likely to trigger a greater level of scrutiny and potential need for mitigation from the FAA.
The results of the analysis back this up: when it comes to shortening FAA obstruction evaluation studies and minimizing the likelihood of long review times, it’s important to consider the full set of aviation features related to obstruction standard height limits.
If you’re interested in learning more about how you can map these features with RootGeo’s data to avoid long FAA review times, please get in touch with us here or on LinkedIn.
- As in previous posts, I used a historical database of FAA wind turbine studies curated by the US Fish & Wildlife Service. ↩︎
- Refer here for brief overview of the FAA obstruction standards. ↩︎
- Based on a Mann-Whitney U Test. ↩︎
- Specifically, proposed turbines exceeding obstruction standards have had reviews ≥365 days long 15.5% of the time, compared to 6.8% of the time for turbines below obstruction standards. ↩︎
