Recently, I was catching up with a friend who also works in the renewable energy/geospatial world. I was describing RootGeo’s airspace datasets and how they are meant to help wind developers, when my friend asked:
“That all sounds very cool, but why are they any better than using a buffer around airports?”
This a great question for a couple of reasons. First, buffers are exceedingly simple to create: every student in a GIS 101 class learns to run a Buffer tool. Second, buffers are already used extensively in the wind industry, where they are known as “setbacks” and are used to site turbines away from various features, ranging from buildings and roads to raptor nests and sensitive archaeological resources.
So, why not use setbacks to avoid the area around airports and their associated aviation concerns?
The answer is: Setbacks are pretty bad at predicting if a wind turbine will conflict with airspace, especially when compared to using real aeronautical features.
In fact, aeronautical features are over 2.5x more effective at predicting hazard determinations by the FAA than using airport setbacks of roughly equivalent size.
Let me explain.
How Turbines are Evaluated for Airspace Concerns

Prior to construction, nearly all proposed commercial wind turbines in the US are required to undergo an aeronautical study performed by the Federal Aviation Administration (FAA) to identify and assess potential effects to “navigable airspace” (i.e., the space that aircraft fly in). The FAA conducts these “Obstruction Evaluation” (OE) studies to ensure that new turbines don’t impose a danger to aircraft or otherwise hinder existing air traffic patterns and operations.1
There are a lot of factors considered in obstruction evaluation studies – too many to cover in this post. But the key point, for now, is that the FAA publicly shares the data for historical and current OE studies. These data include study outcomes: for example, Determinations of Hazard (i.e., the proposed turbine would cause “substantial adverse effect” to navigable airspace or air navigation facilities) or No Hazard (i.e., no substantial adverse effect). In addition, these data are spatial, with latitudes and longitudes for every turbine that the FAA has evaluated.

We can use this dataset to look back at all historical FAA obstruction evaluation cases for proposed wind turbines to see how well a setback would have predicted the determination of Hazard or No Hazard.2 However, looking at setbacks alone only tells part of the story and doesn’t really answer my friend’s original question, which essentially boiled down to: “why are aeronautical features better than setbacks?” So, we’ll do this same analysis of historical OE cases with aeronautical features mapped by RootGeo, and see how the results stack up.
An Alternative to Setbacks: Imaginary Surfaces
The next question we have to answer is: which aeronautical features should we compare setbacks to? As I mentioned before, obstruction evaluation studies consider many different aeronautical features and criteria. Several of those features can be far from airports3; however, in the immediate vicinity of airports, the most applicable feature is arguably imaginary surfaces.
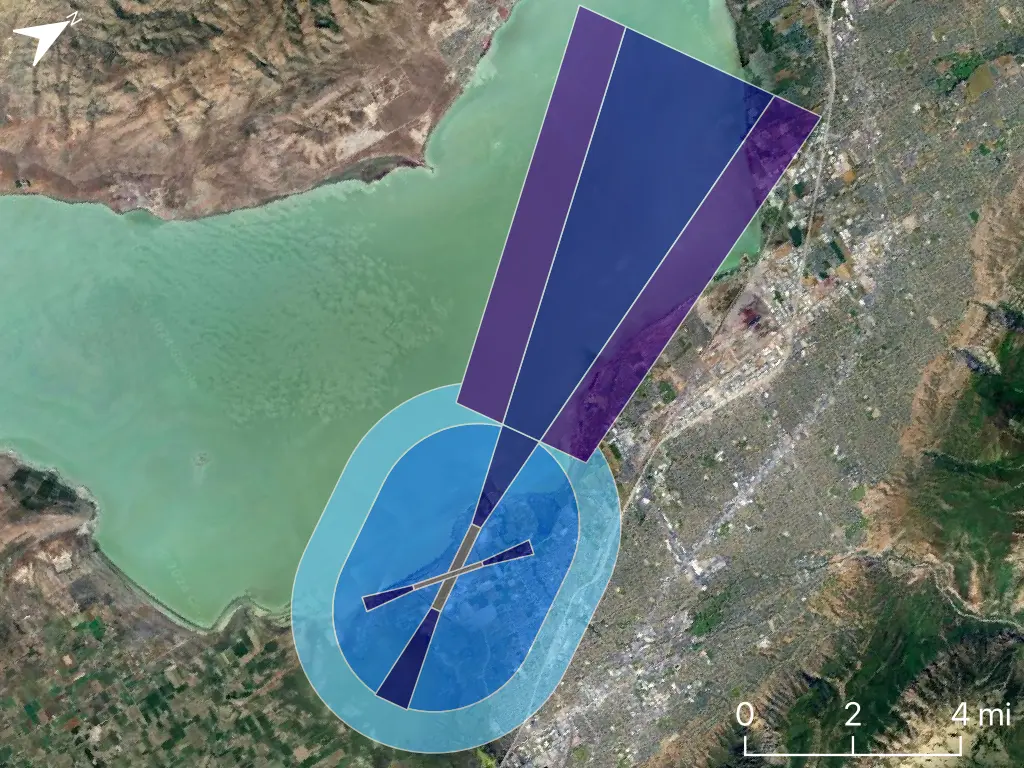
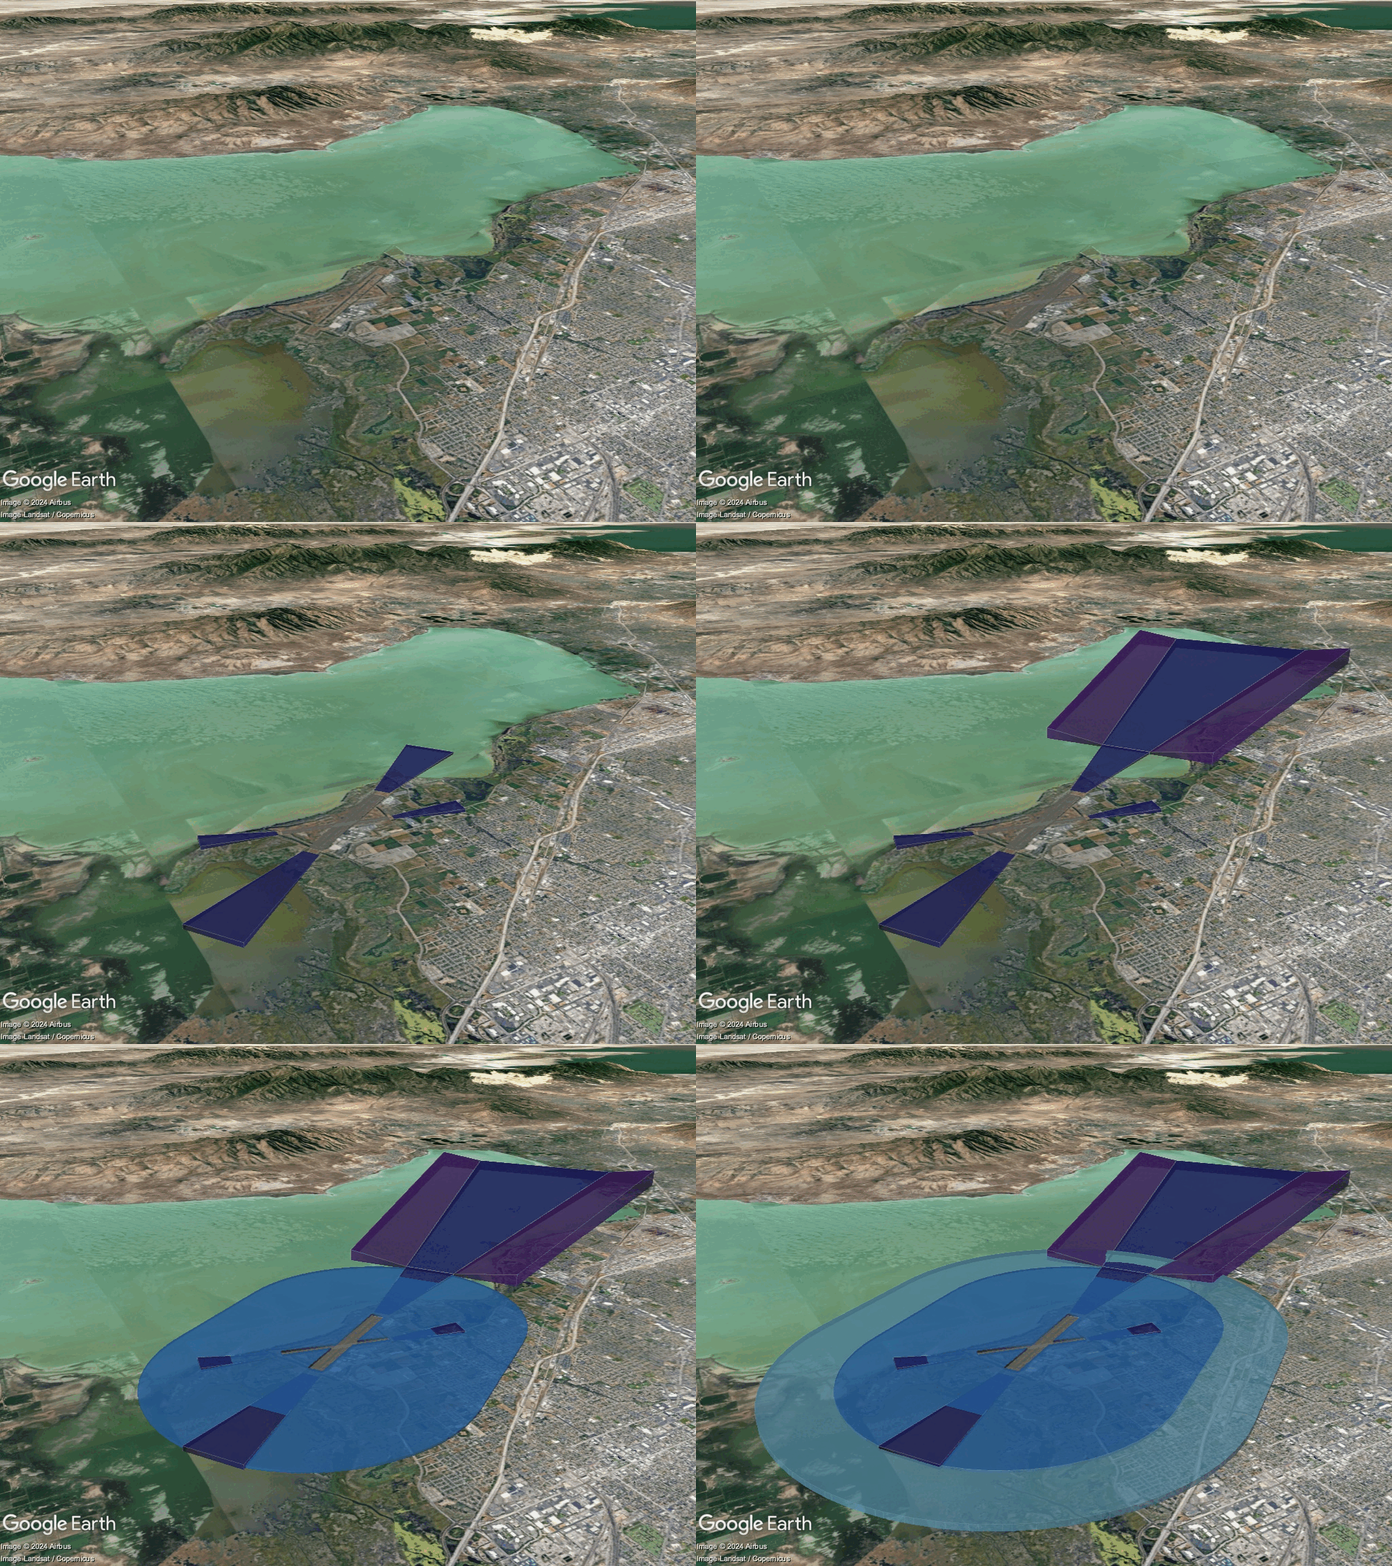
If you’re not familiar with the term, imaginary surfaces are legally defined features that extend up and away from runways.4 They are planar or conical in shape, and have specific dimensions and slopes determined by various attributes of each airport and its runways. Imaginary surfaces are “imaginary” because they aren’t actually visible (and in fact, they even are very hard to map), but are very real in the sense that if you build something that is tall enough to intersect one of them, it will be legally identified as an obstruction to air navigation.5
In 2D (i.e, from above), imaginary surfaces share some similarities with a buffer. Their composite shape encompasses the area around an airport, with some surfaces extending out a bit farther than others. In 3D, the contrast is greater: imaginary surfaces appear as a complex overlay of different height limits – some flat and some sloping – in the area around the airport.


Given their close vicinity to airports, imaginary surfaces provide a good alternative to setbacks. To make the comparison even more apples-to-apples, we can size our setbacks to be equal to the average size of all imaginary surfaces in the continental US (CONUS)6, which is about 3.5 miles in radius.
Recap
Before we get to results, let me provide a quick recap (or overview, if you skipped ahead).
We are using historical cases from the FAA Obstruction Evaluation dataset to analyze how effective a 3.5-mile setback from airports would be at predicting hazard determinations7 for proposed wind turbines. We’re also performing the same analysis with imaginary surfaces and comparing the results.
Predicting Hazards: Setbacks vs. Imaginary Surfaces
So, what do the results show?
Historically, only 25% of wind turbines within 3.5 miles of an airport have been determined by the FAA to be hazards or presumed hazards to navigable airspace. That means that if you were to use a 3.5-mile setback to site your wind farm, you’d be excluding a lot of potentially developable wind turbine locations.
How do imaginary surfaces compare?
In 2D, the results are better, but not by much: 37% of turbines within the boundaries of imaginary surfaces have been determined to be hazards or presumed hazards. However, imaginary surfaces aren’t 2D!
When we account for their actual height limits, imaginary surfaces provide a big improvement. For turbines that exceed the height limits of imaginary surfaces, the FAA has issued a a Determination of Hazard or Presumed Hazard 66% of the time.
This means that imaginary surfaces are over 2.5x more effective at predicting FAA Determinations of Hazard or Presumed Hazard than using airport setbacks of roughly equivalent size.
Conclusion
Based on historical cases from the FAA, using imaginary surfaces to inform wind farm siting can open up much more land for turbines in the vicinity of airports compared to using a simple buffer. This can be provide a critical advantage for wind developers interested in finding, leasing, and planning viable project sites that might otherwise be overlooked.
Now, I’ll readily admit that 66% still leaves a sizable amount of room for improvement. Again, there are many other airspace features that are considered by the FAA and can factor in to their determinations, but that’s something I’ll have to leave for a future post. In the meantime, you can read about some of the other relevant airspace features available from RootGeo at https://rootgeo.com/data/ and if you are interested in exploring imaginary surfaces further, you can download a sample dataset from https://rootgeo.com/samples/.
Notes
- The FAA conducts OE studies on many other tall structures too – e.g., buildings, cranes, bridges, communication towers – but we’ll keep the focus on wind turbines for this discussion. ↩︎
- This analysis used a compiled version of historical FAA OE cases, dated June 2024, acquired from the US Fish & Wildlife Service. The data were filtered to include only wind turbines (“StrType” of “Wind Turbine”, “WINDMILL” or “WINDMILL_FARMS”) in the CONUS with determinations of hazard/presumed hazard (“DETERM” of “Presumed Hazard” or “Hazard”) or no hazard (“DETERM” = “No Hazard”). ↩︎
- Enroute Airways and Minimum Instrument Altitude sectors, for example, span most/all of the CONUS. ↩︎
- For the purposes of this comparison, we’re strictly including only imaginary surfaces defined in Federal Aviation Regulations (FAR) Section 77.19. RootGeo also provides Obstruction Standard surfaces from FAR 77.17(a)(2) as part of our “Imaginary Surfaces” dataset, but these are not technically imaginary surfaces. ↩︎
- Being an obstruction is a prerequisite to a Determination of Hazard. ↩︎
- Setback size was determined using the mean minimum bounding radius of the composite area covered by the imaginary surfaces around each public use airport in the CONUS. ↩︎
- For brevity, I’m using “hazard” to refer to Determinations of both “Hazard” and “Presumed Hazard”. ↩︎
