In case you missed it, my last post explained the criteria the FAA uses to evaluate wind turbines. There’s useful content throughout, but the main insight is this:
“If you want to lower your chances of having to modify or cancel your project, try to site it away from areas where it will trigger [FAA] obstruction standards 2 through 5”.
In this post, I’ll show you how to actually put this advice into practice. If you’ve ever wanted a simple guide for how to incorporate FAA constraints into your wind project site prospecting, this post is for you.
Mapping Airspace Avoidance Areas
Let’s say you were prospecting for new wind project sites in the US. Most likely, you already have a GIS database of siting constraints that you typically treat as avoidance areas – features like wetlands, steep slopes, and building setbacks. To incorporate civil airspace constraints into this process, you’d start by defining a GIS layer representing “airspace avoidance areas” to add to your database.
For civil airspace, the four most relevant features you can use to define avoidance areas are: (1) instrument approach procedures, (2) instrument departure procedures, (3) low-altitude enroute airways; and (4) imaginary surfaces for civil airports (FAR 77.19). These features are particularly useful because they (a) directly relate to FAA Obstruction Standards and (b) are likely correlated with areas that have significant air traffic.1
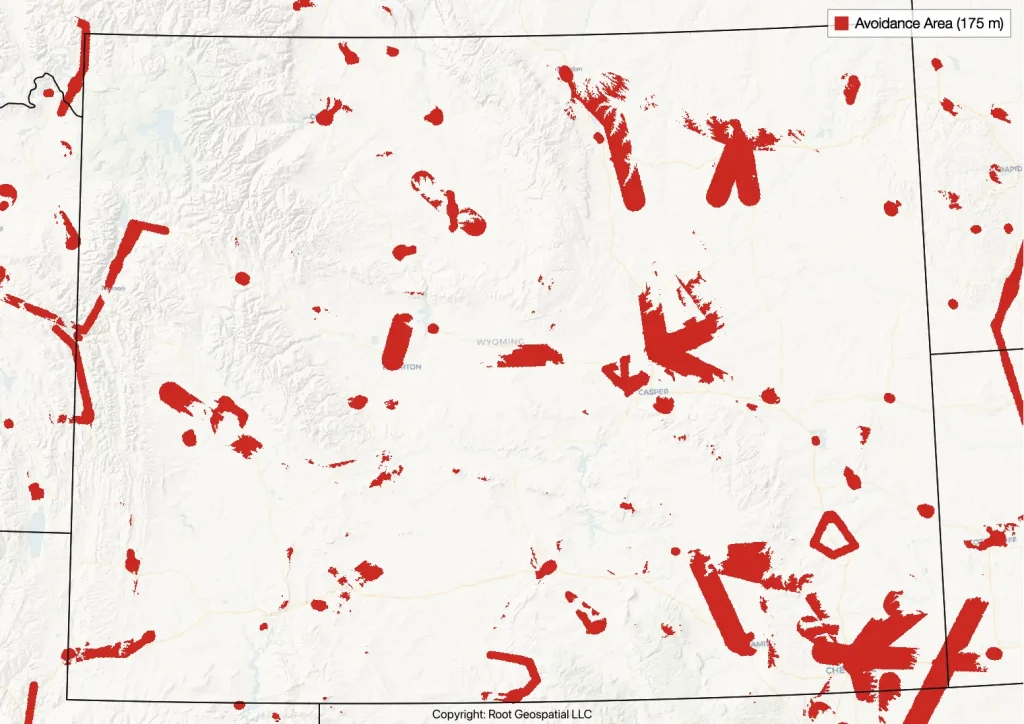
Using GIS datasets from RootGeo, we can map these features of interest and their height limits anywhere in the US. Let’s assume you were planning to use 175 m tall2 turbines and had narrowed in on Wyoming as a broad area of interest. The map below shows areas in red where the composite height limit of the four key civil airspace features is 175 m above ground or less.
If you were site prospecting in Wyoming for a project with 175 m tall turbines, these are the areas you should avoid. Add this as another avoidance area layer in your GIS site prospecting process and you’d give yourself a much better shot at finding sites likely to pass smoothly through FAA review.
Does this Actually Work?
Maybe you’re thinking, “This sounds good in theory, but do these avoidance areas actually matter in practice?” Let’s see if I can convince you.
To do so, we can compare the avoidance areas to a dataset of historical FAA cases.3 This dataset includes over 190,000 proposed wind turbines that have received a Determination of No Hazard from the FAA from March 2000 through July 2024. When you submit for your next Obstruction Evaluation study by the FAA, this is the illustrious group you’re trying to join.
Across this large dataset of proposed turbines approved by the FAA, less than 5 percent are located in conflict with the composite height limits of the four key aviation features described above. The remaining 95% of No Hazard turbines are located either away from these features or below their height limits.
In other words, over the last 20+ years, very few turbines with successful FAA reviews have been sited above the composite height limits of these four GIS datasets.
Taking a Closer Look
Still not convinced? Let’s check out a few examples showing the spatial distribution of “No Hazard” turbines relative to the composite height limits in various locations across the US.
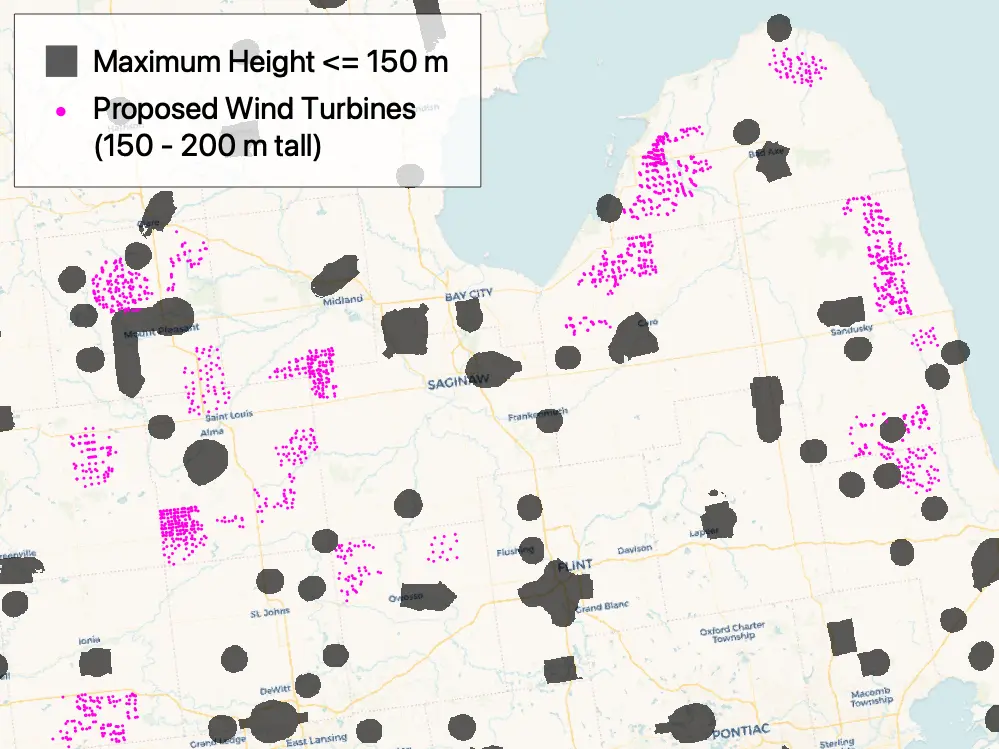
The first example shows an area in the Lower Peninsula of Michigan, centered around the City of Saginaw. The map shows all proposed, No Hazard turbines between 150 and 200 meters tall. Overlaid with the turbines are civil airspace avoidance areas, set to a maximum height limit of 150 meters. Across this region, you can see multiple locations where the proposed turbine arrays wrap closely around, but just outside of the avoidance areas.
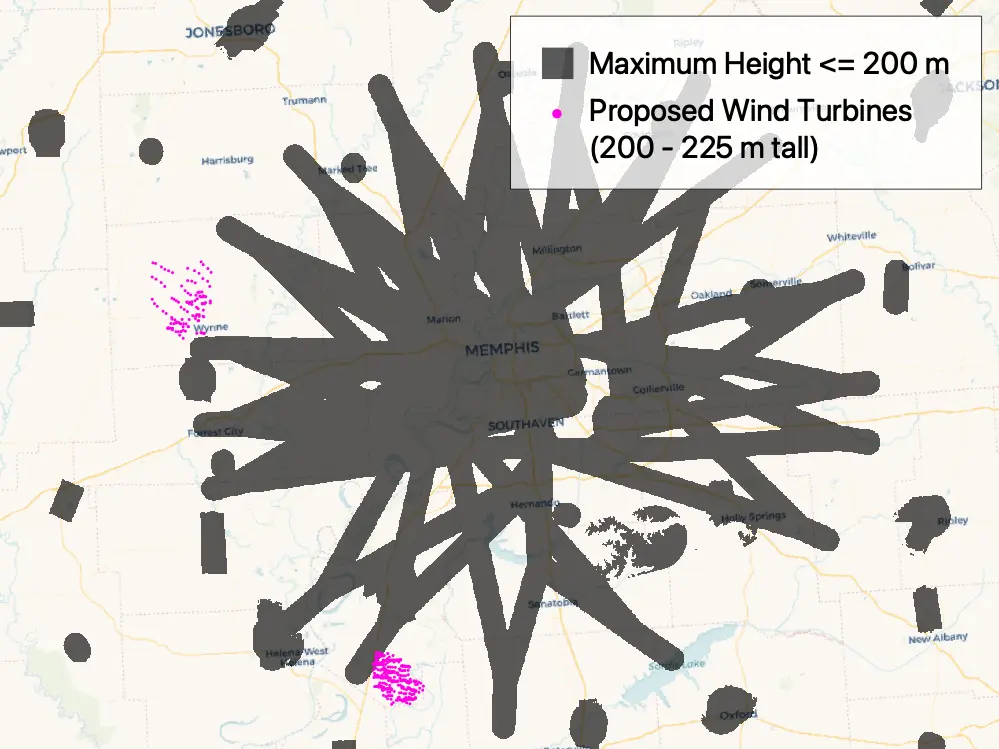
The next example, centered around Memphis, TN, shows a similar dynamic. Here, I’ve limited the map to show 200 – 225 m tall proposed No Hazard Turbines, overlaid by the 200 m maximum height avoidance areas. In this area, there are several departure routes that produce a snowflake-like pattern of avoidance areas. The only No Hazard proposed turbines in this area are located in the spaces between the avoidance areas of these departure routes.
This pattern continues to play out in our final two examples: one north of Amarillo, TX and the other northwest of Tulsa, OK. Each example shows No Hazard proposed turbines that are approximately 150 m tall and the corresponding avoidance areas. Again, in both cases, there are multiple locations where turbines wrap around boundaries of the avoidance areas, getting as close as possible but staying outside.
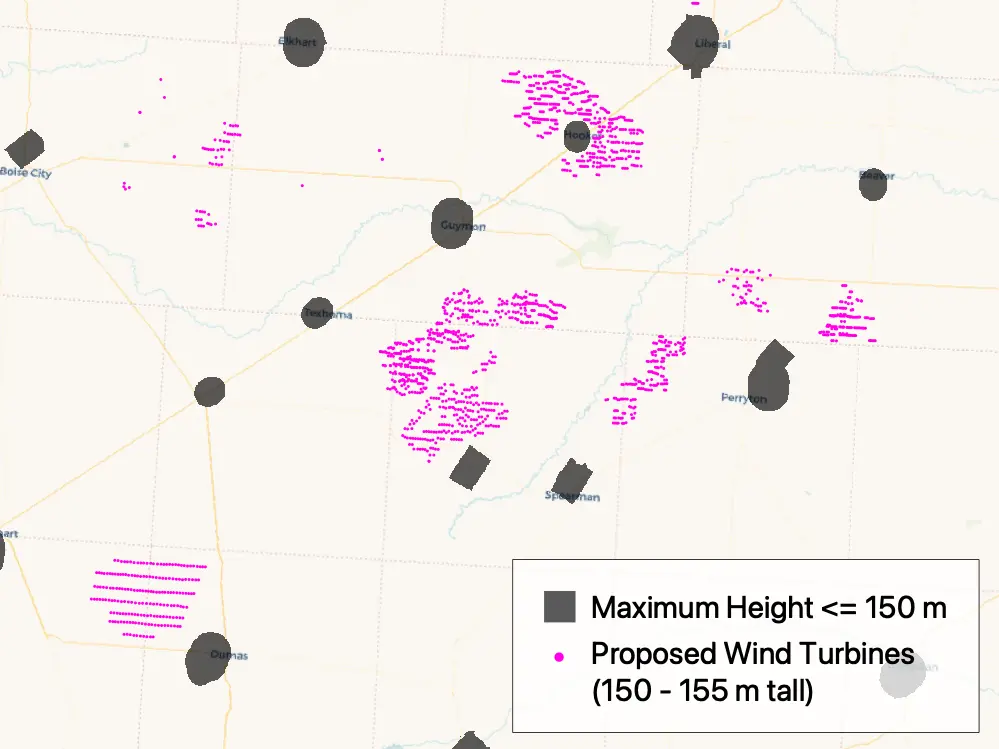
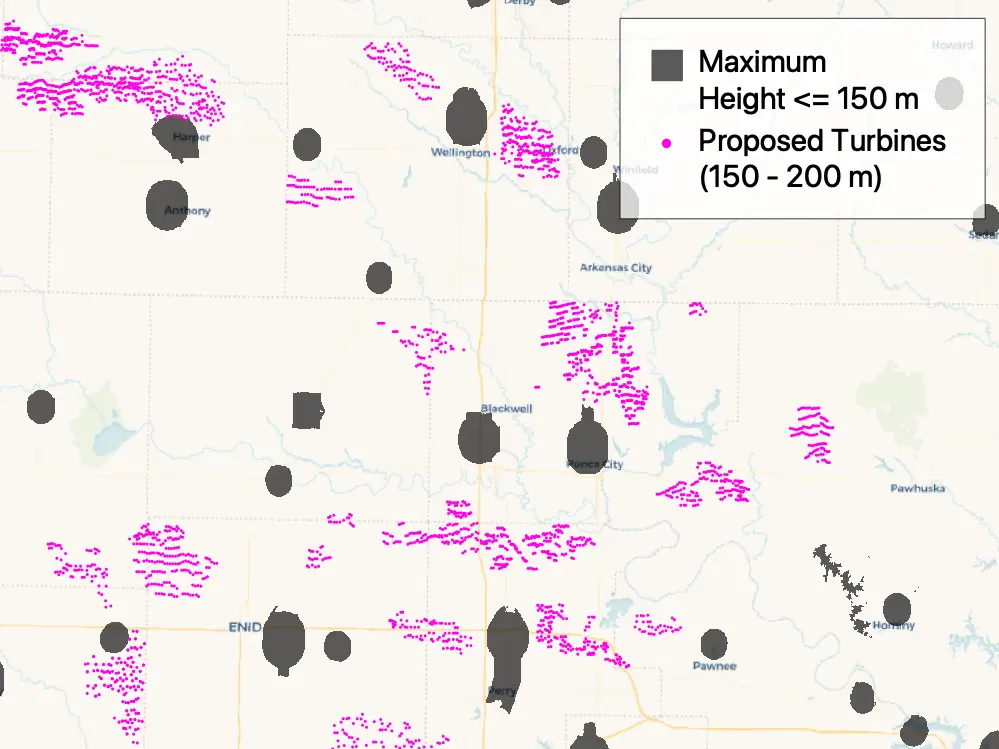
Time and again, we see this similar spatial distribution, suggesting that it’s not a mere coincidence. The composite avoidance areas really do seem to be a critical factor in shaping the layout of turbines that receive successful FAA reviews.
Mapping Additional Areas of Concern
For a more complete map, we can add in other airspace features related to FAA obstruction standards, including Minimum Vector Altitudes, Minimum Instruments Altitudes, and FAR 77.17(a)(2) surfaces.
Unlike the previously discussed features, we don’t want to treat these ones as strict avoidance areas because they are less likely to be correlated with actual air traffic.4 But, that doesn’t change the fact that these features are tied to FAA obstruction standards and could still pose conflicts for your project. So, instead of treating them as strict exclusions, we can map them as areas of heightened concern for potential for conflict, like so:
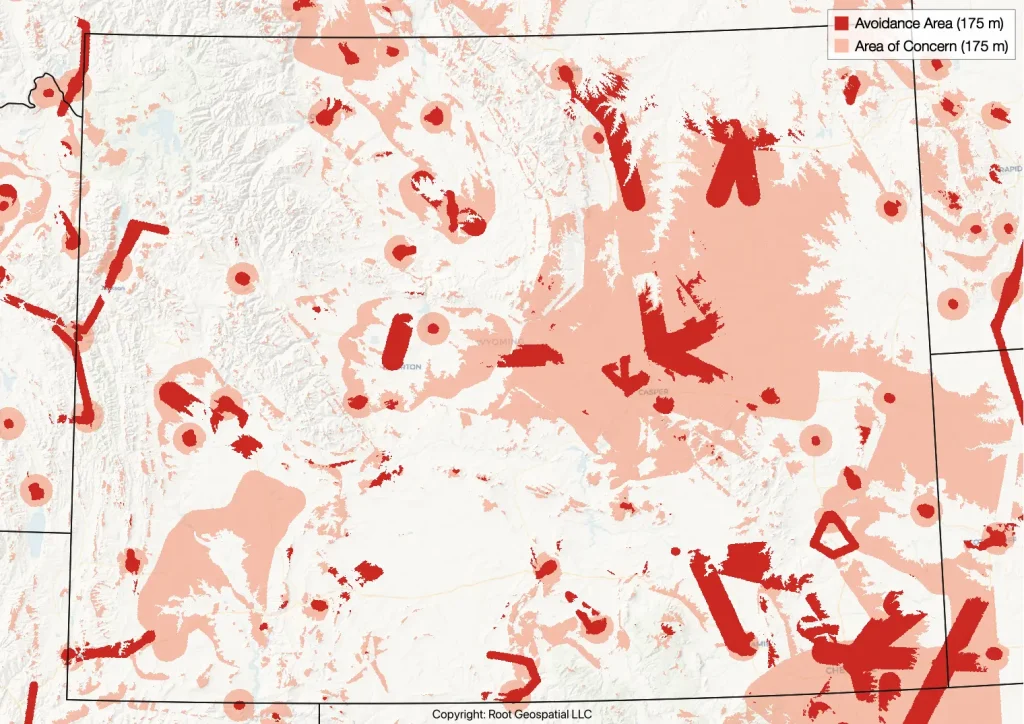
For site prospecting, this becomes another layer you can use—this time, as a soft constraint. If it’s possible, you should find sites outside these areas of concern; however, if it’s not, at least you will know that there is an increased risk of encountering airspace conflicts when you file your Notice of Proposed Construction or Alteration with the FAA, and you can plan accordingly.
Gazing into the Future
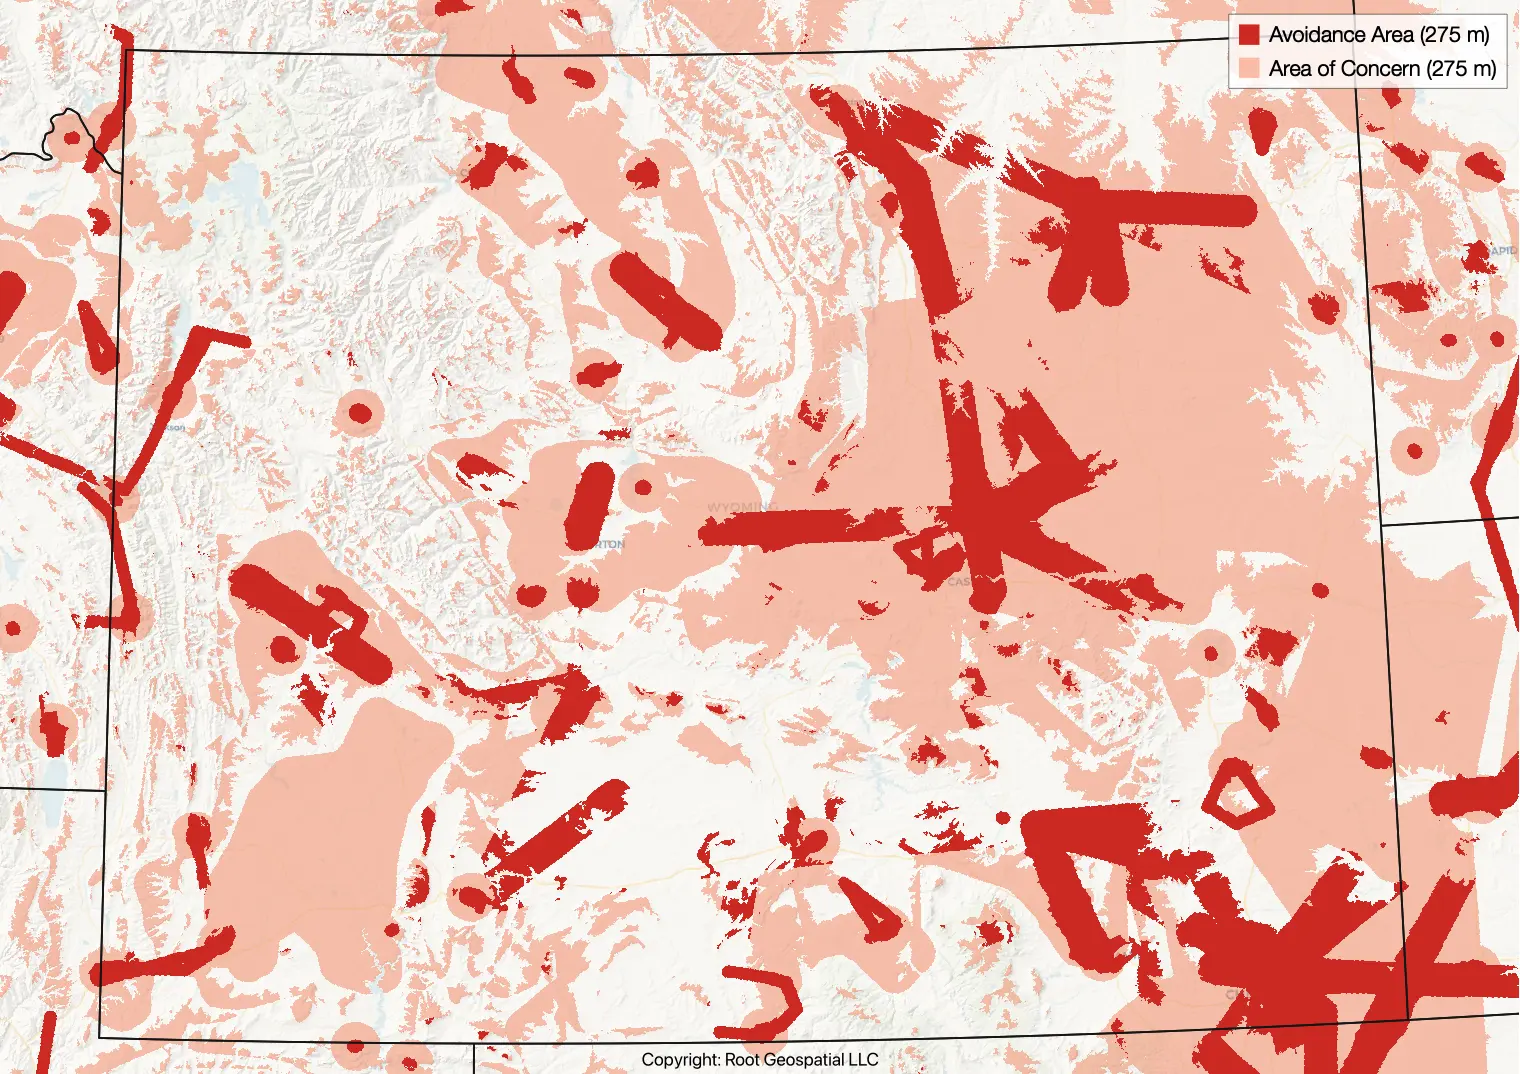
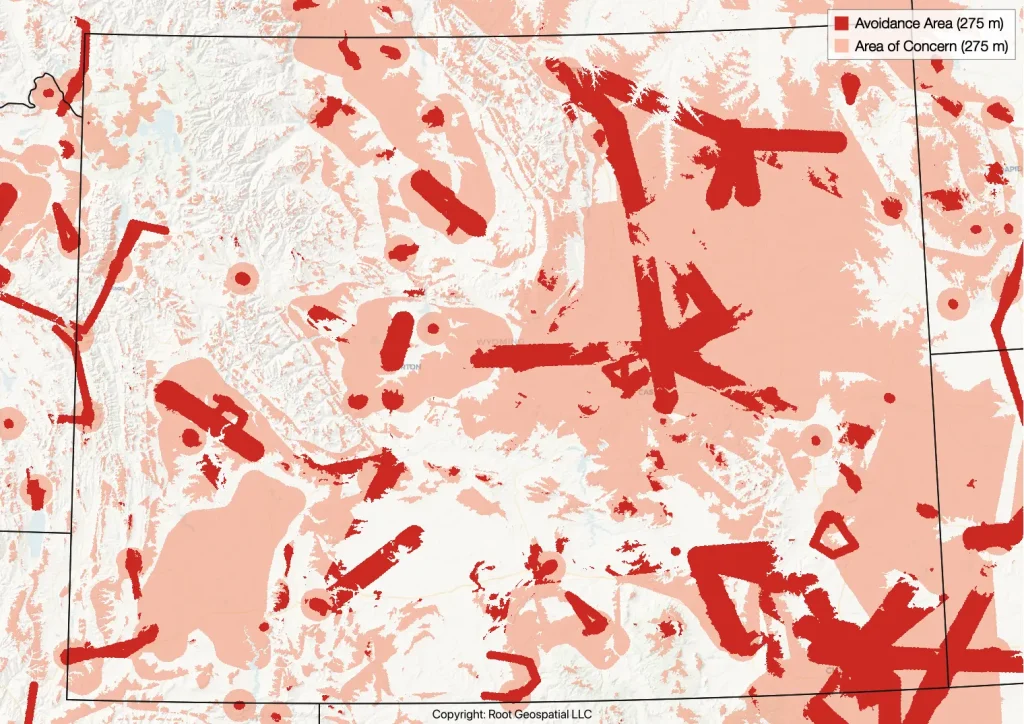
If you’ve stayed with me this long, let’s look at one final example. In this case, we can see how airspace constraints might be different in the near future, as turbines continue to grow in height. Below is the same map as the previous, but for 275 m tall turbine instead of a 175m turbine.
As you can see, there is a significant growth in the extent of both the avoidance areas and the areas of concern areas for turbines 100 m taller. This suggests that aviation limits may become a much greater siting challenge for wind turbines in just a few short years.
Wrapping Up
Hopefully, this post gave you a potential roadmap for how—with the right GIS datasets in hand—you can proactively integrate airspace conflicts into your wind site prospecting process. If you’re ready to start using this approach yourself, get in touch with us here or on LinkedIn.
Notes
- Check out the previous post for details about why these features are important. ↩︎
- Max blade tip height. ↩︎
- Additional detail about these historical case data can be found in this prior post. ↩︎
- The historical data back this up: about 55,000 proposed turbines (~30%) have been sited above the height limits for these three features while still receiving a No Hazard determination from the FAA. ↩︎
